
Visualizing Your Network
 Klaus Mueller
A Network Blueprint
One of the best pieces of advice I received while I was preparing for my CCIE lab back in 1999–2000 was to use a large sheet of paper to draw out and document the lab scenario I had to build. I started using 11x17 (tabloid) paper to draw up the network and keep track of most of the important details like addresses, ports, and interconnectivity. It was a godsend for both configuration amd troubleshooting.
This is still something that I find invaluable to this day - partly because I’m a very visual person, and partly because I just don’t have a good memory for details. My preference for large paper was reinforced several years ago at an Edward Tufte seminar where he expounded on the value of resolution of paper and also extolded the virtues of a larger “canvas” and how our minds can better use the extra visual space to see both patterns and the big picture. (I’m likely butchering his actual points, but that’s how I remember it.)
The diagrams I prefer to use are not high level “marketechure” diagrams, but ones meant to illustrate and document the intricacies of the solution to be implemented and/or supported. I find these diagrams incredibly useful for both thinking through and configuring implementation details, and for troubleshooting problems. In that sense I treat these very much like an architect treats a blueprint for a contractor to build a house.
Keys to building a diagram
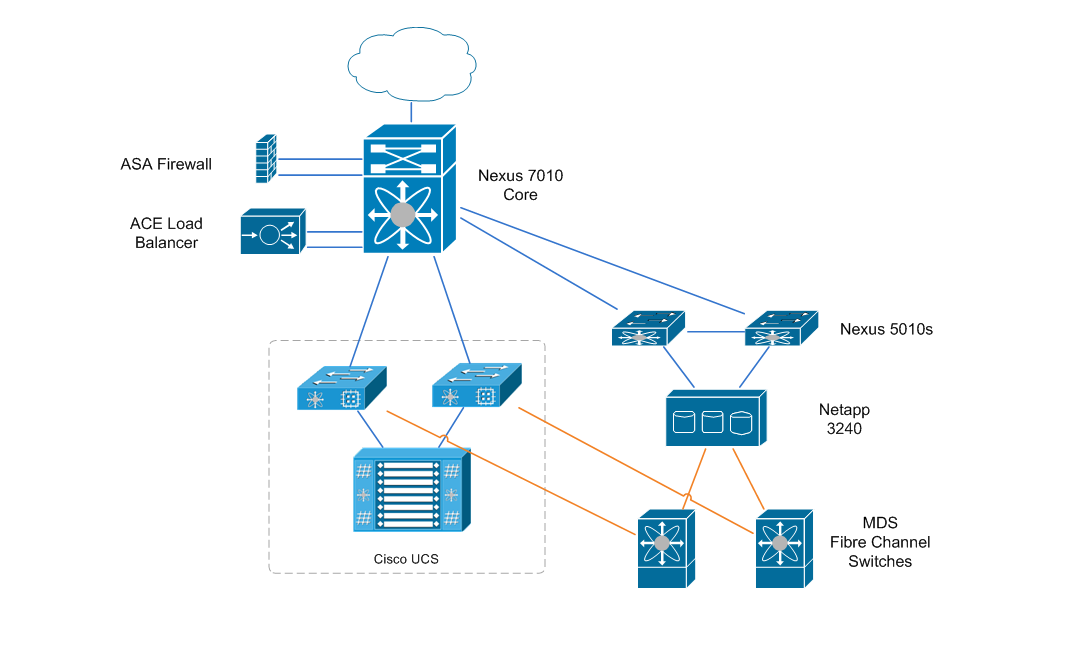
For high-level network diagrams I tend to use vendor Visio stencils (if available) - either the Cisco “Hockey Puck” style, or the equipment specific “front/back” views. These stencils provide a standard visual language that most in IT are familiar with, and therefore provide a great executive level view. I find however that it is hard to get a lot of the detail that is really helpful during implementation on these types of diagrams. These diagrams are most useful as high-level overviews in proposals and presentations and are typically sized at 8.5x11. Too often though in order to fit information into smaller/denser footprint much of the necessary complexity gets lost. It is too easy to simplify connections or components to make it look good in smaller space but thereby losing detail that becomes important when visualizing the actual deployment or trying to find a problem.
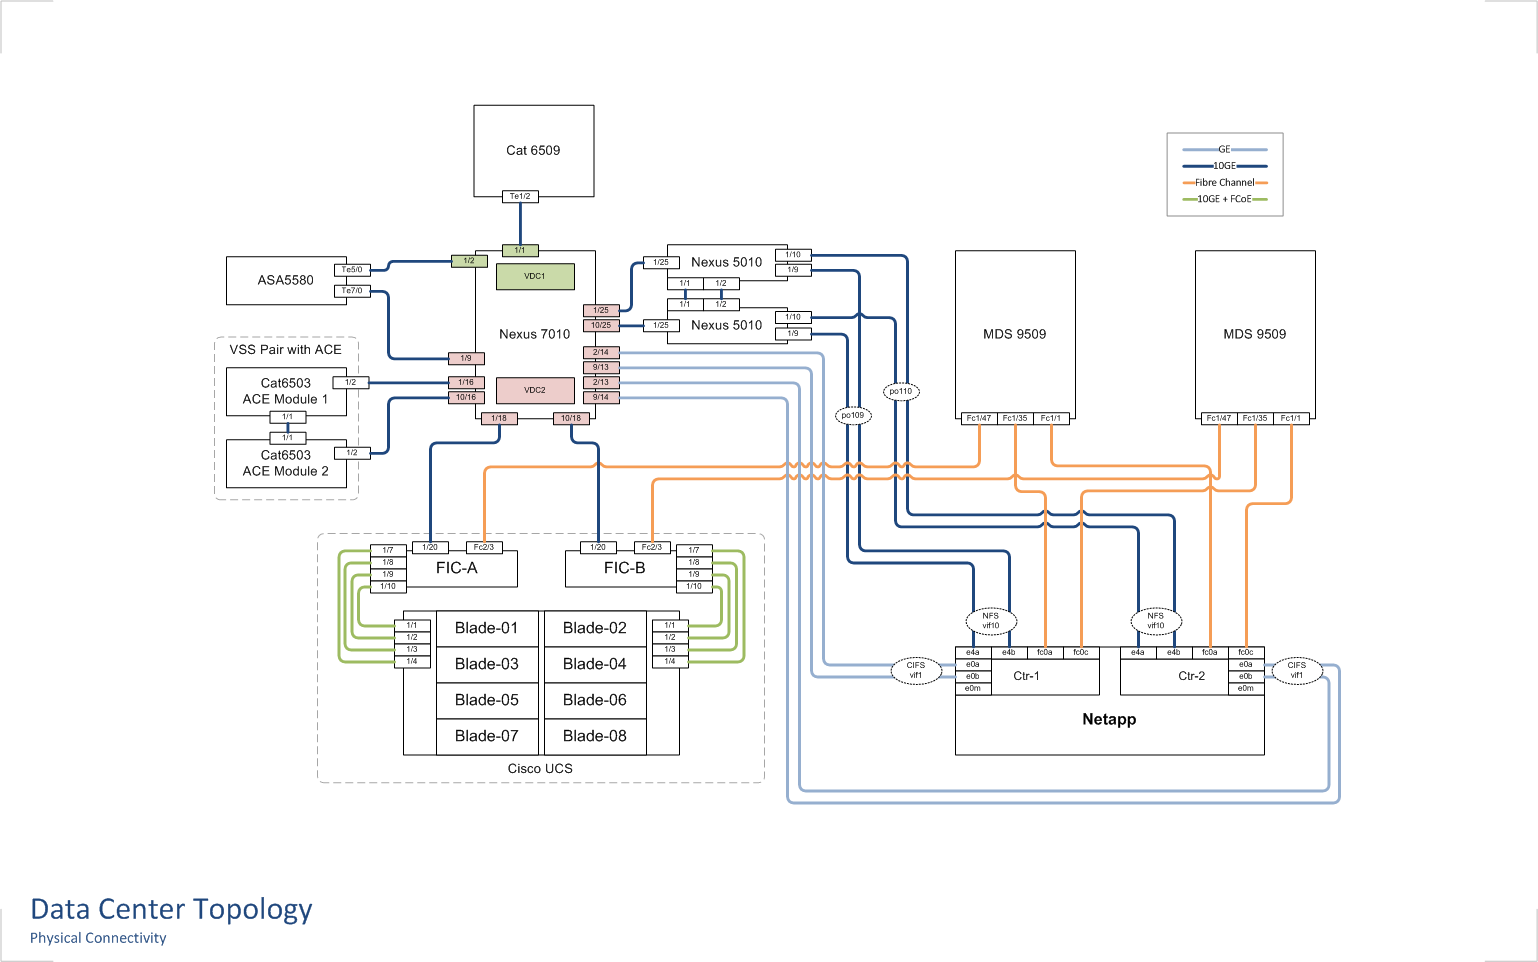
For implementation/support “blueprints” I prefer to use standard basic shapes such as rectangles and circles as it allows me to add that additional level of detail. From simple items such as hostname and management IP addresses to interface numbering I find it is much more readable on a simple diagram.
Keys to building good diagrams…
Here are some of the guidelines that I use when building diagrams that I feel make them much more useable:
- Go big – use as big a “canvas” as you can. We are fortunate to have a printer at the office that can print 11x17 Tabloid size diagrams, so that has become my default size. I find that starting a diagram in Visio or Omnigraffle (my preferred Mac diagramming tool) on a large size gives me plenty of room to make a diagram that doesn’t seem to busy. These diagrams usually will look just as good when printed out on standard 8.5x11 paper too, and Visios or PDFs will scale automatically to print on smaller paper. Even for a hand-drawn diagram, an 11x17 page provides plenty of room to draw and then annotate liberally.
- Use whitespace – try not to cram too much into a diagram and leave plenty of whitespace. This is especially useful when using diagrams for troubleshooting as it leaves plenty of space for handwritten notes.
- Color code – use standard color coding for components such as network connections. I typically use a light blue for 1 Gigabit Ethernet links, a dark blue for 10 Gigabit Ethernet links, orange for Fibre Channel, etc…
- Indicate physical locations – many LAN diagrams I see don’t differentiate between locations within a building or campus. The diagram will simply show a core switch and any number of access switches, when in actuality some access switches might be in the same rack as the core switch, while others could be several buildings away. That is useful information to have when both implementing and troubleshooting. A simple labeled box around a stack of switches can help immensly.
- Keep it simple and focused – there is a fine line between useful detail and overloading a diagram. If a subsystem (say a firewall/dmz/Internet solution) has a lot of complexity then its probably best to have a separate diagram for just that detail, rather than trying to incoporate that detail into a big picture LAN topology.
- Draw your own diagram – even if someone else has drawn a diagram, I find it useful to do my own. It’s not that my diagrams are better, but the process of drawing it helps me think through the specifics, and maybe even see some detail that was not apparent on the original.
I see too many environments that don’t have or maintain accurate diagrams and documentation. A good diagram can be invaluable when maintaining or troubleshooting an environment. Although I focus mostly on network diagrams I think these same principles can apply to all IT system out there.
Reader Comments